

Picture Credits: Netflix
Welcome to your weekly rundown of the biggest hits and misses on Netflix. For the week ending May 24th, 2026, we’re looking at a surprisingly sluggish start for The Duffer Brothers’ latest sci-fi venture, The Boroughs, and a lukewarm debut for the highly anticipated rom-com Ladies First. Plus, we’re checking in on returning favorites, diving into global trends, and analyzing everything in between.
First, the no-shows: Mating Season, the new animated series from the creative minds behind Big Mouth, failed to crack the charts. It’s only sitting at 15th in the global top 10s at the time of publishing and is already dropping. While recent seasons of Big Mouth did manage to chart (despite season-to-season drops), logging less than 2.1M views is a rough start for this new venture.
Other no-shows include another UK Untold doc, with Liverpool’s Miracle of Istanbul not making the top 10. Carizzma from Argentina also failed to rank.
Also, we might need to pour one out for KPop Demon Hunters, as its reign in the weekly top 10s looks poised to end either this week or very soon. It’s a crying shame, given it’s coming up on 52 straight weeks… Can the fans rally to help it snatch another incredible record? We’ll have to wait and find out.
Now let’s get into the headlines and charts!
1. The Boroughs Debuts Weak In Week 1
Since its debut on Thursday, it’s been clear that this new sci-fi series from The Duffer Brothers—their second project of 2026—was going to face a slow march up the charts. As of publishing, the show has finally managed to topple Berlin S2 globally, suggesting we’ll see some strength in week 2. But you probably know where we’re going with this.
With just 35.3M hours and 5.6M views, the series is sitting quite low in the charts and is by no means a smash hit. We previously noted that the creators have a multi-season plan and that season 2 is already in active development. If it hopes to secure those extra seasons, it’ll need to pick up the pace and display some strong backend metrics (like completion rate) that we don’t necessarily have access to. Here’s how the series stacks up against other season 1 debuts in recent years that all dropped on a Thursday:
(function () {
if (!window.wonWatermarkPlugin) {
window.wonWatermarkPlugin = {
id: ‘wonWatermark’,
afterDraw: function (chart) {
var ctx = chart.ctx;
var area = chart.chartArea;
if (!ctx || !area) return;
// Scale watermark to the chart’s current pixel width so it stays
// a subtle attribution on phones (20px on a 320px canvas would
// dominate) while still reading on a 1200px desktop chart.
var w = area.right – area.left;
var fontSize = Math.max(11, Math.min(20, Math.round(w * 0.045)));
var offset = Math.max(6, Math.round(w * 0.018));
ctx.save();
ctx.font=”700 ” + fontSize + ‘px -apple-system, BlinkMacSystemFont, “Segoe UI”, Arial, sans-serif’;
ctx.fillStyle=”rgba(0, 0, 0, 0.22)”;
ctx.textAlign = ‘right’;
ctx.textBaseline=”bottom”;
ctx.fillText(‘whats-on-netflix.com’, area.right – offset, area.bottom – Math.max(4, Math.round(offset * 0.6)));
ctx.restore();
}
};
}
// Shared compact-number helper. Returns e.g. “1.2B”, “45.6M”, “789K” when
// useCompact is true, otherwise the full `toLocaleString()` form. Used by
// every chart’s datalabels and axis ticks on mobile so wide numbers like
// “1,234,567,890” don’t crowd small viewports. Tooltips keep the full
// number for accuracy.
if (!window.wonCompactNumber) {
window.wonCompactNumber = function (value, useCompact) {
if (value === null || value === undefined || isNaN(value)) return ”;
var n = Number(value);
if (!useCompact) {
return n.toLocaleString();
}
try {
if (typeof Intl !== ‘undefined’ && Intl.NumberFormat) {
if (!window.wonCompactFormatter) {
window.wonCompactFormatter = new Intl.NumberFormat(‘en’, {
notation: ‘compact’,
maximumFractionDigits: 1
});
}
return window.wonCompactFormatter.format(n);
}
} catch (e) {}
// Manual fallback for browsers without Intl compact notation support.
var abs = Math.abs(n);
var divisor, suffix;
if (abs >= 1e9) { divisor = 1e9; suffix = ‘B’; }
else if (abs >= 1e6) { divisor = 1e6; suffix = ‘M’; }
else if (abs >= 1e3) { divisor = 1e3; suffix = ‘K’; }
else { return n.toLocaleString(); }
var scaled = n / divisor;
var formatted = scaled.toFixed(scaled >= 100 ? 0 : (scaled >= 10 ? 1 : 2));
return formatted.replace(/(\.\d*?)0+$/, ‘$1’).replace(/\.$/, ”) + suffix;
};
}
// Mirror the host theme’s body font onto Chart.js defaults so chart text
// (ticks, legend, tooltips, datalabels) matches the surrounding article.
// Chart.js is loaded with `defer`, so we wait for DOMContentLoaded before
// touching `Chart.defaults` — by that point Chart.js is guaranteed to be
// parsed but no chart in this file has instantiated yet (their init code
// also runs on DOMContentLoaded, and they’re registered after this block
// in HTML source order, so listener-registration order keeps us first).
if (window.wonChartFontDefaults) return;
window.wonChartFontDefaults = true;
function applyThemeChartFont() {
if (typeof Chart === ‘undefined’ || !Chart.defaults || !Chart.defaults.font) {
return false;
}
var bodyFont=””;
try {
bodyFont = getComputedStyle(document.body).fontFamily || ”;
} catch (e) {}
if (bodyFont) {
Chart.defaults.font.family = bodyFont;
}
return true;
}
if (document.readyState === ‘loading’) {
document.addEventListener(‘DOMContentLoaded’, applyThemeChartFont);
} else {
applyThemeChartFont();
}
})();
{
“@context”: “https://schema.org”,
“@type”: “Dataset”,
“name”: “Netflix Viewership Comparison – UNTAMED – Season 1, The Night Agent – Season 1, Man on Fire – Season 1, 3 Body Problem – Season 1, Man on Fire – Season 1 and 18 more Netflix titles (1-week cumulative views)”,
“description”: “Cumulative weekly views for UNTAMED – Season 1, The Night Agent – Season 1, Man on Fire – Season 1, 3 Body Problem – Season 1, Man on Fire – Season 1 and 18 more Netflix titles on Netflix over 1 weeks. UNTAMED – Season 1 leads the comparison with 24,600,000 cumulative views. Combined total: 194,700,000 views. Data sourced from Netflix’s official Top 10 engagement reports.”,
“license”: “https://www.whats-on-netflix.com/corrections-policy/”,
“keywords”: “Netflix, viewership, streaming data, Netflix Top 10, weekly views, audience metrics, UNTAMED – Season 1, The Night Agent – Season 1, Man on Fire – Season 1, 3 Body Problem – Season 1, Man on Fire – Season 1, Black Doves – Season 1, 1899 – Season 1, The Diplomat – Season 1”,
“creator”: {
“@type”: “Organization”,
“name”: “What’s on Netflix”,
“url”: “https://www.whats-on-netflix.com/”
},
“publisher”: {
“@type”: “Organization”,
“name”: “What’s on Netflix”,
“url”: “https://www.whats-on-netflix.com/”
},
“datePublished”: “2026-05-26”,
“dateModified”: “2026-05-26”,
“variableMeasured”: “Cumulative weekly views (Netflix Top 10)”,
“measurementTechnique”: “Aggregation of Netflix’s official weekly Top 10 engagement reports”,
“temporalCoverage”: “1 weeks”,
“spatialCoverage”: “Global”,
“isAccessibleForFree”: true,
“about”: [
{“@type”:”CreativeWork”,”name”:”UNTAMED – Season 1″},
{“@type”:”CreativeWork”,”name”:”The Night Agent – Season 1″},
{“@type”:”CreativeWork”,”name”:”Man on Fire – Season 1″},
{“@type”:”CreativeWork”,”name”:”3 Body Problem – Season 1″},
{“@type”:”CreativeWork”,”name”:”Man on Fire – Season 1″},
{“@type”:”CreativeWork”,”name”:”Black Doves – Season 1″},
{“@type”:”CreativeWork”,”name”:”1899 – Season 1″},
{“@type”:”CreativeWork”,”name”:”The Diplomat – Season 1″},
{“@type”:”CreativeWork”,”name”:”The Waterfront – Season 1″},
{“@type”:”CreativeWork”,”name”:”The Abandons – Season 1″} ],
“distribution”: {
“@type”: “DataDownload”,
“encodingFormat”: “JSON”,
“contentUrl”: “#netflix_bar_graph_6a16157529c38” }
}
(function() {
var showLabels = true;
var titleHighlight = “The Boroughs – Season 1”;
// Title rendered above the chart in place of the legend (1 week → “Opening Week”).
var chartTitle = “Opening Week Views”;
function loadScript(src, callback) {
var script = document.createElement(‘script’);
script.src = src;
script.onload = callback;
document.head.appendChild(script);
}
function createChart() {
var canvasEl = document.getElementById(‘netflix_bar_graph_6a16157529c38’);
var ctx = canvasEl.getContext(‘2d’);
// Detect mobile screen size
var isMobile = window.innerWidth <= 768;
var isSmallMobile = window.innerWidth 0) {
var perTitle = isSmallMobile ? 38 : (isMobile ? 44 : 50);
var basePad = isSmallMobile ? 80 : (isMobile ? 90 : 100);
var targetH = titleCount * perTitle + basePad;
canvasEl.height = targetH;
canvasEl.style.height = targetH + ‘px’;
}
var chartConfig = {
type: ‘bar’,
data: {
labels: [“UNTAMED – Season 1″,”The Night Agent – Season 1″,”Man on Fire – Season 1″,”3 Body Problem – Season 1″,”Man on Fire – Season 1″,”Black Doves – Season 1″,”1899 – Season 1″,”The Diplomat – Season 1″,”The Waterfront – Season 1″,”The Abandons – Season 1″,”Ransom Canyon – Season 1″,”Nemesis – Season 1″,”The Recruit – Season 1″,”Nemesis – Season 1″,”Obliterated – Season 1″,”PULSE – Season 1″,”The Boroughs – Season 1″,”The Lincoln Lawyer – Season 1″,”Something Very Bad Is Going to Happen”,”The Brothers Sun – Season 1″,”KAOS – Season 1″,”Dead Boy Detectives – Season 1″,”Big Mistakes – Season 1″],
datasets: [{
label: chartTitle,
data: [24600000,20600000,11000000,11000000,11000000,10800000,10800000,8500000,8300000,7300000,7200000,7100000,7100000,7100000,7000000,6500000,5600000,5400000,4500000,4100000,3400000,3100000,2700000],
backgroundColor: [“#b9090b”,”#b9090b”,”#b9090b”,”#b9090b”,”#b9090b”,”#b9090b”,”#b9090b”,”#b9090b”,”#b9090b”,”#b9090b”,”#b9090b”,”#b9090b”,”#b9090b”,”#b9090b”,”#b9090b”,”#b9090b”,”#000″,”#b9090b”,”#b9090b”,”#b9090b”,”#b9090b”,”#b9090b”,”#b9090b”],
borderColor: [“#b9090b”,”#b9090b”,”#b9090b”,”#b9090b”,”#b9090b”,”#b9090b”,”#b9090b”,”#b9090b”,”#b9090b”,”#b9090b”,”#b9090b”,”#b9090b”,”#b9090b”,”#b9090b”,”#b9090b”,”#b9090b”,”#000″,”#b9090b”,”#b9090b”,”#b9090b”,”#b9090b”,”#b9090b”,”#b9090b”],
borderWidth: 0,
hoverBackgroundColor: [“#8a0708″,”#8a0708″,”#8a0708″,”#8a0708″,”#8a0708″,”#8a0708″,”#8a0708″,”#8a0708″,”#8a0708″,”#8a0708″,”#8a0708″,”#8a0708″,”#8a0708″,”#8a0708″,”#8a0708″,”#8a0708″,”#1a1a1a”,”#8a0708″,”#8a0708″,”#8a0708″,”#8a0708″,”#8a0708″,”#8a0708″],
hoverBorderColor: ‘#b9090b’,
hoverBorderWidth: 2,
barPercentage: 0.9,
categoryPercentage: 0.9
}]
},
options: {
responsive: true,
maintainAspectRatio: false,
indexAxis: ‘y’,
layout: {
padding: { bottom: isMobile ? 12 : 24, top: 8 }
},
plugins: {
title: {
display: true,
text: chartTitle,
color: ‘#000000’,
align: ‘start’,
font: {
size: titleFontSize,
weight: ‘bold’
},
padding: { top: 4, bottom: 16 }
},
legend: { display: false },
tooltip: {
backgroundColor: ‘#221f1f’,
titleColor: ‘#b9090b’,
bodyColor: ‘#ffffff’,
titleFont: { weight: ‘bold’, size: 13 },
bodyFont: { size: 13 },
padding: { top: 10, bottom: 10, left: 14, right: 14 },
cornerRadius: 6,
displayColors: false,
borderColor: ‘#b9090b’,
borderWidth: 1,
callbacks: {
label: function(context) {
return context.dataset.label + ‘: ‘ + context.parsed.x.toLocaleString();
}
}
}
},
scales: {
x: {
beginAtZero: true,
ticks: {
font: {
size: axisFontSize
},
// Compact “1.2M” / “789K” ticks on mobile so the
// x-axis doesn’t eat half the chart width.
callback: function (value) {
if (window.wonCompactNumber) {
return window.wonCompactNumber(value, isMobile);
}
return value;
}
}
},
y: {
ticks: {
// Bold + brand-red color for the highlighted title’s y-axis tick;
// muted gray for everything else when a highlight is active.
font: function (context) {
var label = context.tick && context.tick.label;
if (titleHighlight && label === titleHighlight) {
return { weight: ‘bold’, size: axisFontSize };
}
return { size: axisFontSize };
},
color: function (context) {
var label = context.tick && context.tick.label;
if (titleHighlight && label === titleHighlight) {
return ‘#b9090b’;
}
return ‘#000000’;
}
}
}
},
}
};
// Add DataLabels configuration if labels are enabled
if (showLabels && window.ChartDataLabels) {
// Small bars (< 15% of max) get their label floated *above* the bar
// tip in Netflix red, so it never overlaps the red bar and never
// becomes black-on-red. A white text stroke keeps the label
// readable even when the chart sits on a coloured/image background.
var isSmallBar = function(context) {
var value = context.dataset.data[context.dataIndex];
if (typeof value === 'undefined' || value === null) return false;
var maxValue = Math.max.apply(null, context.dataset.data.filter(function(v) {
return v !== null && v !== undefined;
}));
if (!maxValue) return false;
return (value / maxValue) * 100 < 15;
};
chartConfig.options.plugins.datalabels = {
anchor: function(context) {
return isSmallBar(context) ? 'end' : 'center';
},
align: function(context) {
return isSmallBar(context) ? 'end' : 'center';
},
offset: function(context) {
return isSmallBar(context) ? 4 : 0;
},
color: function(context) {
return isSmallBar(context) ? '#b9090b' : '#fff';
},
textStrokeColor: function(context) {
return isSmallBar(context) ? '#ffffff' : 'rgba(0,0,0,0.35)';
},
textStrokeWidth: 2,
clip: false,
clamp: true,
font: {
weight: 'bold',
size: dataLabelFontSize
},
formatter: function(value) {
if (window.wonCompactNumber) {
return window.wonCompactNumber(value, true);
}
return value;
},
display: function(context) {
var value = context.dataset.data[context.dataIndex];
return typeof value !== 'undefined' && value !== null;
}
};
chartConfig.plugins = [ChartDataLabels];
}
// Always register the watermark plugin (independent of data labels).
chartConfig.plugins = (chartConfig.plugins || []).concat(
window.wonWatermarkPlugin ? [window.wonWatermarkPlugin] : []
);
var chart = new Chart(ctx, chartConfig);
}
function ensureChartAndPlugin() {
if (!window.Chart) {
loadScript('https://cdn.jsdelivr.net/npm/chart.js@4.4.4/dist/chart.umd.min.js', function() {
ensureChartAndPlugin();
});
} else if (showLabels && !window.ChartDataLabels) {
loadScript('https://cdn.jsdelivr.net/npm/chartjs-plugin-datalabels@2.2.0', function() {
createChart();
});
} else {
createChart();
}
}
if (document.readyState === 'loading') {
document.addEventListener('DOMContentLoaded', ensureChartAndPlugin);
} else {
ensureChartAndPlugin();
}
})();
.sr-only {
position: absolute !important;
width: 1px !important;
height: 1px !important;
padding: 0 !important;
margin: -1px !important;
overflow: hidden !important;
clip: rect(0, 0, 0, 0) !important;
white-space: nowrap !important;
border: 0 !important;
}
.netflix-data-chart-container {
position: relative;
margin-bottom: 40px;
}
.netflix-data-chart-container table {
border-collapse: collapse;
width: 100%;
margin: 10px 0;
}
.netflix-data-chart-container th,
.netflix-data-chart-container td {
border: 1px solid #ddd;
padding: 8px;
text-align: left;
}
.netflix-data-chart-container th {
background-color: #f2f2f2;
font-weight: bold;
}
/* Dark mode support for netflix bar graph – mobile only */
@media (prefers-color-scheme: dark) and (max-width: 768px) {
.netflix-data-chart-container {
background-color: #ffffff;
padding: 20px;
border-radius: 8px;
box-shadow: 0 2px 10px rgba(0, 0, 0, 0.1);
}
.netflix-data-chart-container canvas {
background-color: #ffffff;
}
.netflix-data-chart-container table {
background-color: #ffffff;
}
.netflix-data-chart-container th,
.netflix-data-chart-container td {
background-color: #ffffff;
color: #333333;
border: 1px solid #ddd;
}
.netflix-data-chart-container th {
background-color: #f2f2f2;
color: #333333;
}
}
/* Additional dark mode support for better contrast – mobile only */
@media (prefers-color-scheme: dark) and (max-width: 768px) {
.netflix-data-chart-container .sr-only {
color: #333333;
}
}
/* Mobile responsive font sizes */
@media (max-width: 768px) {
.netflix-data-chart-container canvas {
font-size: 12px !important;
}
}
@media (max-width: 480px) {
.netflix-data-chart-container canvas {
font-size: 10px !important;
}
}
2. Ladies First Also Weak In Week 1

Ladies First. (L-R) Sacha Baron Cohen as Damien Sachs and Rosamund Pike as Alex Fox in Ladies First. Cr. Rob Youngson/Netflix © 2026.
Also on the weaker side this week is Ladies First. The new romantic comedy starring Rosamund Pike and Sacha Baron Cohen debuted with just 11.9M views, making it the third-weakest debut for any English-language Friday movie of 2026 so far.
{
“@context”: “https://schema.org”,
“@type”: “Dataset”,
“name”: “Netflix Viewership Comparison – The Rip, War Machine, Apex, Thrash, Peaky Blinders: The Immortal Man and 6 more Netflix titles (1-week cumulative views)”,
“description”: “Cumulative weekly views for The Rip, War Machine, Apex, Thrash, Peaky Blinders: The Immortal Man and 6 more Netflix titles on Netflix over 1 weeks. The Rip leads the comparison with 41,600,000 cumulative views. Combined total: 258,400,000 views. Data sourced from Netflix’s official Top 10 engagement reports.”,
“license”: “https://www.whats-on-netflix.com/corrections-policy/”,
“keywords”: “Netflix, viewership, streaming data, Netflix Top 10, weekly views, audience metrics, The Rip, War Machine, Apex, Thrash, Peaky Blinders: The Immortal Man, People We Meet on Vacation, Swapped, Joe’s College Road Trip”,
“creator”: {
“@type”: “Organization”,
“name”: “What’s on Netflix”,
“url”: “https://www.whats-on-netflix.com/”
},
“publisher”: {
“@type”: “Organization”,
“name”: “What’s on Netflix”,
“url”: “https://www.whats-on-netflix.com/”
},
“datePublished”: “2026-05-26”,
“dateModified”: “2026-05-26”,
“variableMeasured”: “Cumulative weekly views (Netflix Top 10)”,
“measurementTechnique”: “Aggregation of Netflix’s official weekly Top 10 engagement reports”,
“temporalCoverage”: “1 weeks”,
“spatialCoverage”: “Global”,
“isAccessibleForFree”: true,
“about”: [
{“@type”:”CreativeWork”,”name”:”The Rip”},
{“@type”:”CreativeWork”,”name”:”War Machine”},
{“@type”:”CreativeWork”,”name”:”Apex”},
{“@type”:”CreativeWork”,”name”:”Thrash”},
{“@type”:”CreativeWork”,”name”:”Peaky Blinders: The Immortal Man”},
{“@type”:”CreativeWork”,”name”:”People We Meet on Vacation”},
{“@type”:”CreativeWork”,”name”:”Swapped”},
{“@type”:”CreativeWork”,”name”:”Joe’s College Road Trip”},
{“@type”:”CreativeWork”,”name”:”Ladies First”},
{“@type”:”CreativeWork”,”name”:”Remarkably Bright Creatures”} ],
“distribution”: {
“@type”: “DataDownload”,
“encodingFormat”: “JSON”,
“contentUrl”: “#netflix_bar_graph_6a16157529ce1” }
}
(function() {
var showLabels = true;
var titleHighlight = “Ladies First”;
// Title rendered above the chart in place of the legend (1 week → “Opening Week”).
var chartTitle = “Opening Week Views”;
function loadScript(src, callback) {
var script = document.createElement(‘script’);
script.src = src;
script.onload = callback;
document.head.appendChild(script);
}
function createChart() {
var canvasEl = document.getElementById(‘netflix_bar_graph_6a16157529ce1’);
var ctx = canvasEl.getContext(‘2d’);
// Detect mobile screen size
var isMobile = window.innerWidth <= 768;
var isSmallMobile = window.innerWidth 0) {
var perTitle = isSmallMobile ? 38 : (isMobile ? 44 : 50);
var basePad = isSmallMobile ? 80 : (isMobile ? 90 : 100);
var targetH = titleCount * perTitle + basePad;
canvasEl.height = targetH;
canvasEl.style.height = targetH + ‘px’;
}
var chartConfig = {
type: ‘bar’,
data: {
labels: [“The Rip”,”War Machine”,”Apex”,”Thrash”,”Peaky Blinders: The Immortal Man”,”People We Meet on Vacation”,”Swapped”,”Joe’s College Road Trip”,”Ladies First”,”Remarkably Bright Creatures”,”Roommates”],
datasets: [{
label: chartTitle,
data: [41600000,39300000,38200000,37700000,25300000,17200000,15500000,12500000,11900000,10400000,8800000],
backgroundColor: [“#b9090b”,”#b9090b”,”#b9090b”,”#b9090b”,”#b9090b”,”#b9090b”,”#b9090b”,”#b9090b”,”#000″,”#b9090b”,”#b9090b”],
borderColor: [“#b9090b”,”#b9090b”,”#b9090b”,”#b9090b”,”#b9090b”,”#b9090b”,”#b9090b”,”#b9090b”,”#000″,”#b9090b”,”#b9090b”],
borderWidth: 0,
hoverBackgroundColor: [“#8a0708″,”#8a0708″,”#8a0708″,”#8a0708″,”#8a0708″,”#8a0708″,”#8a0708″,”#8a0708″,”#1a1a1a”,”#8a0708″,”#8a0708″],
hoverBorderColor: ‘#b9090b’,
hoverBorderWidth: 2,
barPercentage: 0.9,
categoryPercentage: 0.9
}]
},
options: {
responsive: true,
maintainAspectRatio: false,
indexAxis: ‘y’,
layout: {
padding: { bottom: isMobile ? 12 : 24, top: 8 }
},
plugins: {
title: {
display: true,
text: chartTitle,
color: ‘#000000’,
align: ‘start’,
font: {
size: titleFontSize,
weight: ‘bold’
},
padding: { top: 4, bottom: 16 }
},
legend: { display: false },
tooltip: {
backgroundColor: ‘#221f1f’,
titleColor: ‘#b9090b’,
bodyColor: ‘#ffffff’,
titleFont: { weight: ‘bold’, size: 13 },
bodyFont: { size: 13 },
padding: { top: 10, bottom: 10, left: 14, right: 14 },
cornerRadius: 6,
displayColors: false,
borderColor: ‘#b9090b’,
borderWidth: 1,
callbacks: {
label: function(context) {
return context.dataset.label + ‘: ‘ + context.parsed.x.toLocaleString();
}
}
}
},
scales: {
x: {
beginAtZero: true,
ticks: {
font: {
size: axisFontSize
},
// Compact “1.2M” / “789K” ticks on mobile so the
// x-axis doesn’t eat half the chart width.
callback: function (value) {
if (window.wonCompactNumber) {
return window.wonCompactNumber(value, isMobile);
}
return value;
}
}
},
y: {
ticks: {
// Bold + brand-red color for the highlighted title’s y-axis tick;
// muted gray for everything else when a highlight is active.
font: function (context) {
var label = context.tick && context.tick.label;
if (titleHighlight && label === titleHighlight) {
return { weight: ‘bold’, size: axisFontSize };
}
return { size: axisFontSize };
},
color: function (context) {
var label = context.tick && context.tick.label;
if (titleHighlight && label === titleHighlight) {
return ‘#b9090b’;
}
return ‘#000000’;
}
}
}
},
}
};
// Add DataLabels configuration if labels are enabled
if (showLabels && window.ChartDataLabels) {
// Small bars (< 15% of max) get their label floated *above* the bar
// tip in Netflix red, so it never overlaps the red bar and never
// becomes black-on-red. A white text stroke keeps the label
// readable even when the chart sits on a coloured/image background.
var isSmallBar = function(context) {
var value = context.dataset.data[context.dataIndex];
if (typeof value === 'undefined' || value === null) return false;
var maxValue = Math.max.apply(null, context.dataset.data.filter(function(v) {
return v !== null && v !== undefined;
}));
if (!maxValue) return false;
return (value / maxValue) * 100 < 15;
};
chartConfig.options.plugins.datalabels = {
anchor: function(context) {
return isSmallBar(context) ? 'end' : 'center';
},
align: function(context) {
return isSmallBar(context) ? 'end' : 'center';
},
offset: function(context) {
return isSmallBar(context) ? 4 : 0;
},
color: function(context) {
return isSmallBar(context) ? '#b9090b' : '#fff';
},
textStrokeColor: function(context) {
return isSmallBar(context) ? '#ffffff' : 'rgba(0,0,0,0.35)';
},
textStrokeWidth: 2,
clip: false,
clamp: true,
font: {
weight: 'bold',
size: dataLabelFontSize
},
formatter: function(value) {
if (window.wonCompactNumber) {
return window.wonCompactNumber(value, true);
}
return value;
},
display: function(context) {
var value = context.dataset.data[context.dataIndex];
return typeof value !== 'undefined' && value !== null;
}
};
chartConfig.plugins = [ChartDataLabels];
}
// Always register the watermark plugin (independent of data labels).
chartConfig.plugins = (chartConfig.plugins || []).concat(
window.wonWatermarkPlugin ? [window.wonWatermarkPlugin] : []
);
var chart = new Chart(ctx, chartConfig);
}
function ensureChartAndPlugin() {
if (!window.Chart) {
loadScript('https://cdn.jsdelivr.net/npm/chart.js@4.4.4/dist/chart.umd.min.js', function() {
ensureChartAndPlugin();
});
} else if (showLabels && !window.ChartDataLabels) {
loadScript('https://cdn.jsdelivr.net/npm/chartjs-plugin-datalabels@2.2.0', function() {
createChart();
});
} else {
createChart();
}
}
if (document.readyState === 'loading') {
document.addEventListener('DOMContentLoaded', ensureChartAndPlugin);
} else {
ensureChartAndPlugin();
}
})();
.sr-only {
position: absolute !important;
width: 1px !important;
height: 1px !important;
padding: 0 !important;
margin: -1px !important;
overflow: hidden !important;
clip: rect(0, 0, 0, 0) !important;
white-space: nowrap !important;
border: 0 !important;
}
.netflix-data-chart-container {
position: relative;
margin-bottom: 40px;
}
.netflix-data-chart-container table {
border-collapse: collapse;
width: 100%;
margin: 10px 0;
}
.netflix-data-chart-container th,
.netflix-data-chart-container td {
border: 1px solid #ddd;
padding: 8px;
text-align: left;
}
.netflix-data-chart-container th {
background-color: #f2f2f2;
font-weight: bold;
}
/* Dark mode support for netflix bar graph – mobile only */
@media (prefers-color-scheme: dark) and (max-width: 768px) {
.netflix-data-chart-container {
background-color: #ffffff;
padding: 20px;
border-radius: 8px;
box-shadow: 0 2px 10px rgba(0, 0, 0, 0.1);
}
.netflix-data-chart-container canvas {
background-color: #ffffff;
}
.netflix-data-chart-container table {
background-color: #ffffff;
}
.netflix-data-chart-container th,
.netflix-data-chart-container td {
background-color: #ffffff;
color: #333333;
border: 1px solid #ddd;
}
.netflix-data-chart-container th {
background-color: #f2f2f2;
color: #333333;
}
}
/* Additional dark mode support for better contrast – mobile only */
@media (prefers-color-scheme: dark) and (max-width: 768px) {
.netflix-data-chart-container .sr-only {
color: #333333;
}
}
/* Mobile responsive font sizes */
@media (max-width: 768px) {
.netflix-data-chart-container canvas {
font-size: 12px !important;
}
}
@media (max-width: 480px) {
.netflix-data-chart-container canvas {
font-size: 10px !important;
}
}
Of course, those are a mix of genres, so let’s stack it up against some movies in recent years that are similar(ish) in theme:
{
“@context”: “https://schema.org”,
“@type”: “Dataset”,
“name”: “Netflix Viewership Comparison – A Family Affair, Mother of the Bride, Irish Wish, Find Me Falling, Love at First Sight and 5 more Netflix titles (1-week cumulative views)”,
“description”: “Cumulative weekly views for A Family Affair, Mother of the Bride, Irish Wish, Find Me Falling, Love at First Sight and 5 more Netflix titles on Netflix over 1 weeks. A Family Affair leads the comparison with 26,800,000 cumulative views. Combined total: 147,900,000 views. Data sourced from Netflix’s official Top 10 engagement reports.”,
“license”: “https://www.whats-on-netflix.com/corrections-policy/”,
“keywords”: “Netflix, viewership, streaming data, Netflix Top 10, weekly views, audience metrics, A Family Affair, Mother of the Bride, Irish Wish, Find Me Falling, Love at First Sight, Ladies First, Lonely Planet, A Tourist’s Guide to Love”,
“creator”: {
“@type”: “Organization”,
“name”: “What’s on Netflix”,
“url”: “https://www.whats-on-netflix.com/”
},
“publisher”: {
“@type”: “Organization”,
“name”: “What’s on Netflix”,
“url”: “https://www.whats-on-netflix.com/”
},
“datePublished”: “2026-05-26”,
“dateModified”: “2026-05-26”,
“variableMeasured”: “Cumulative weekly views (Netflix Top 10)”,
“measurementTechnique”: “Aggregation of Netflix’s official weekly Top 10 engagement reports”,
“temporalCoverage”: “1 weeks”,
“spatialCoverage”: “Global”,
“isAccessibleForFree”: true,
“about”: [
{“@type”:”CreativeWork”,”name”:”A Family Affair”},
{“@type”:”CreativeWork”,”name”:”Mother of the Bride”},
{“@type”:”CreativeWork”,”name”:”Irish Wish”},
{“@type”:”CreativeWork”,”name”:”Find Me Falling”},
{“@type”:”CreativeWork”,”name”:”Love at First Sight”},
{“@type”:”CreativeWork”,”name”:”Ladies First”},
{“@type”:”CreativeWork”,”name”:”Lonely Planet”},
{“@type”:”CreativeWork”,”name”:”A Tourist’s Guide to Love”},
{“@type”:”CreativeWork”,”name”:”French Lover”},
{“@type”:”CreativeWork”,”name”:”The Perfect Find”} ],
“distribution”: {
“@type”: “DataDownload”,
“encodingFormat”: “JSON”,
“contentUrl”: “#netflix_bar_graph_6a16157529d63” }
}
(function() {
var showLabels = true;
var titleHighlight = “Ladies First”;
// Title rendered above the chart in place of the legend (1 week → “Opening Week”).
var chartTitle = “Opening Week Views”;
function loadScript(src, callback) {
var script = document.createElement(‘script’);
script.src = src;
script.onload = callback;
document.head.appendChild(script);
}
function createChart() {
var canvasEl = document.getElementById(‘netflix_bar_graph_6a16157529d63’);
var ctx = canvasEl.getContext(‘2d’);
// Detect mobile screen size
var isMobile = window.innerWidth <= 768;
var isSmallMobile = window.innerWidth 0) {
var perTitle = isSmallMobile ? 38 : (isMobile ? 44 : 50);
var basePad = isSmallMobile ? 80 : (isMobile ? 90 : 100);
var targetH = titleCount * perTitle + basePad;
canvasEl.height = targetH;
canvasEl.style.height = targetH + ‘px’;
}
var chartConfig = {
type: ‘bar’,
data: {
labels: [“A Family Affair”,”Mother of the Bride”,”Irish Wish”,”Find Me Falling”,”Love at First Sight”,”Ladies First”,”Lonely Planet”,”A Tourist’s Guide to Love”,”French Lover”,”The Perfect Find”],
datasets: [{
label: chartTitle,
data: [26800000,26700000,19500000,14400000,14100000,11900000,11000000,8400000,8100000,7000000],
backgroundColor: [“#b9090b”,”#b9090b”,”#b9090b”,”#b9090b”,”#b9090b”,”#000″,”#b9090b”,”#b9090b”,”#b9090b”,”#b9090b”],
borderColor: [“#b9090b”,”#b9090b”,”#b9090b”,”#b9090b”,”#b9090b”,”#000″,”#b9090b”,”#b9090b”,”#b9090b”,”#b9090b”],
borderWidth: 0,
hoverBackgroundColor: [“#8a0708″,”#8a0708″,”#8a0708″,”#8a0708″,”#8a0708″,”#1a1a1a”,”#8a0708″,”#8a0708″,”#8a0708″,”#8a0708″],
hoverBorderColor: ‘#b9090b’,
hoverBorderWidth: 2,
barPercentage: 0.9,
categoryPercentage: 0.9
}]
},
options: {
responsive: true,
maintainAspectRatio: false,
indexAxis: ‘y’,
layout: {
padding: { bottom: isMobile ? 12 : 24, top: 8 }
},
plugins: {
title: {
display: true,
text: chartTitle,
color: ‘#000000’,
align: ‘start’,
font: {
size: titleFontSize,
weight: ‘bold’
},
padding: { top: 4, bottom: 16 }
},
legend: { display: false },
tooltip: {
backgroundColor: ‘#221f1f’,
titleColor: ‘#b9090b’,
bodyColor: ‘#ffffff’,
titleFont: { weight: ‘bold’, size: 13 },
bodyFont: { size: 13 },
padding: { top: 10, bottom: 10, left: 14, right: 14 },
cornerRadius: 6,
displayColors: false,
borderColor: ‘#b9090b’,
borderWidth: 1,
callbacks: {
label: function(context) {
return context.dataset.label + ‘: ‘ + context.parsed.x.toLocaleString();
}
}
}
},
scales: {
x: {
beginAtZero: true,
ticks: {
font: {
size: axisFontSize
},
// Compact “1.2M” / “789K” ticks on mobile so the
// x-axis doesn’t eat half the chart width.
callback: function (value) {
if (window.wonCompactNumber) {
return window.wonCompactNumber(value, isMobile);
}
return value;
}
}
},
y: {
ticks: {
// Bold + brand-red color for the highlighted title’s y-axis tick;
// muted gray for everything else when a highlight is active.
font: function (context) {
var label = context.tick && context.tick.label;
if (titleHighlight && label === titleHighlight) {
return { weight: ‘bold’, size: axisFontSize };
}
return { size: axisFontSize };
},
color: function (context) {
var label = context.tick && context.tick.label;
if (titleHighlight && label === titleHighlight) {
return ‘#b9090b’;
}
return ‘#000000’;
}
}
}
},
}
};
// Add DataLabels configuration if labels are enabled
if (showLabels && window.ChartDataLabels) {
// Small bars (< 15% of max) get their label floated *above* the bar
// tip in Netflix red, so it never overlaps the red bar and never
// becomes black-on-red. A white text stroke keeps the label
// readable even when the chart sits on a coloured/image background.
var isSmallBar = function(context) {
var value = context.dataset.data[context.dataIndex];
if (typeof value === 'undefined' || value === null) return false;
var maxValue = Math.max.apply(null, context.dataset.data.filter(function(v) {
return v !== null && v !== undefined;
}));
if (!maxValue) return false;
return (value / maxValue) * 100 < 15;
};
chartConfig.options.plugins.datalabels = {
anchor: function(context) {
return isSmallBar(context) ? 'end' : 'center';
},
align: function(context) {
return isSmallBar(context) ? 'end' : 'center';
},
offset: function(context) {
return isSmallBar(context) ? 4 : 0;
},
color: function(context) {
return isSmallBar(context) ? '#b9090b' : '#fff';
},
textStrokeColor: function(context) {
return isSmallBar(context) ? '#ffffff' : 'rgba(0,0,0,0.35)';
},
textStrokeWidth: 2,
clip: false,
clamp: true,
font: {
weight: 'bold',
size: dataLabelFontSize
},
formatter: function(value) {
if (window.wonCompactNumber) {
return window.wonCompactNumber(value, true);
}
return value;
},
display: function(context) {
var value = context.dataset.data[context.dataIndex];
return typeof value !== 'undefined' && value !== null;
}
};
chartConfig.plugins = [ChartDataLabels];
}
// Always register the watermark plugin (independent of data labels).
chartConfig.plugins = (chartConfig.plugins || []).concat(
window.wonWatermarkPlugin ? [window.wonWatermarkPlugin] : []
);
var chart = new Chart(ctx, chartConfig);
}
function ensureChartAndPlugin() {
if (!window.Chart) {
loadScript('https://cdn.jsdelivr.net/npm/chart.js@4.4.4/dist/chart.umd.min.js', function() {
ensureChartAndPlugin();
});
} else if (showLabels && !window.ChartDataLabels) {
loadScript('https://cdn.jsdelivr.net/npm/chartjs-plugin-datalabels@2.2.0', function() {
createChart();
});
} else {
createChart();
}
}
if (document.readyState === 'loading') {
document.addEventListener('DOMContentLoaded', ensureChartAndPlugin);
} else {
ensureChartAndPlugin();
}
})();
.sr-only {
position: absolute !important;
width: 1px !important;
height: 1px !important;
padding: 0 !important;
margin: -1px !important;
overflow: hidden !important;
clip: rect(0, 0, 0, 0) !important;
white-space: nowrap !important;
border: 0 !important;
}
.netflix-data-chart-container {
position: relative;
margin-bottom: 40px;
}
.netflix-data-chart-container table {
border-collapse: collapse;
width: 100%;
margin: 10px 0;
}
.netflix-data-chart-container th,
.netflix-data-chart-container td {
border: 1px solid #ddd;
padding: 8px;
text-align: left;
}
.netflix-data-chart-container th {
background-color: #f2f2f2;
font-weight: bold;
}
/* Dark mode support for netflix bar graph – mobile only */
@media (prefers-color-scheme: dark) and (max-width: 768px) {
.netflix-data-chart-container {
background-color: #ffffff;
padding: 20px;
border-radius: 8px;
box-shadow: 0 2px 10px rgba(0, 0, 0, 0.1);
}
.netflix-data-chart-container canvas {
background-color: #ffffff;
}
.netflix-data-chart-container table {
background-color: #ffffff;
}
.netflix-data-chart-container th,
.netflix-data-chart-container td {
background-color: #ffffff;
color: #333333;
border: 1px solid #ddd;
}
.netflix-data-chart-container th {
background-color: #f2f2f2;
color: #333333;
}
}
/* Additional dark mode support for better contrast – mobile only */
@media (prefers-color-scheme: dark) and (max-width: 768px) {
.netflix-data-chart-container .sr-only {
color: #333333;
}
}
/* Mobile responsive font sizes */
@media (max-width: 768px) {
.netflix-data-chart-container canvas {
font-size: 12px !important;
}
}
@media (max-width: 480px) {
.netflix-data-chart-container canvas {
font-size: 10px !important;
}
}
3. Swapped vs KPop Demon Hunters in Week 4
Swapped, now in week 4, suffered a 38.4% drop in viewing hours this week. As its curve begins to flatten in the chart below, it’s looking increasingly likely that it won’t pull off a KPop Demon Hunters-style run. Still, it’s putting considerable distance between itself and every other Netflix Original animated film the streamer has ever released. Overall, an incredible success.
{
“@context”: “https://schema.org”,
“@type”: “Dataset”,
“name”: “Netflix Cumulative Views Over Time – Swapped, KPop Demon Hunters and The Sea Beast (9-week trend)”,
“description”: “Week-by-week cumulative views trend for Swapped, KPop Demon Hunters and The Sea Beast on Netflix across 9 weeks. KPop Demon Hunters finishes the period with the highest cumulative count at 210,600,000 views. Combined final total: 403,100,000 views. Data sourced from Netflix’s official Top 10 engagement reports.”,
“license”: “https://www.whats-on-netflix.com/corrections-policy/”,
“keywords”: “Netflix, cumulative views, viewership trend, Netflix Top 10, weekly views, time series, Swapped, KPop Demon Hunters, The Sea Beast”,
“creator”: {
“@type”: “Organization”,
“name”: “What’s on Netflix”,
“url”: “https://www.whats-on-netflix.com/”
},
“publisher”: {
“@type”: “Organization”,
“name”: “What’s on Netflix”,
“url”: “https://www.whats-on-netflix.com/”
},
“datePublished”: “2026-05-26”,
“dateModified”: “2026-05-26”,
“variableMeasured”: “Cumulative weekly views over time (Netflix Top 10)”,
“measurementTechnique”: “Running totals derived from Netflix’s official weekly Top 10 engagement reports”,
“temporalCoverage”: “9 weeks”,
“spatialCoverage”: “Global”,
“isAccessibleForFree”: true,
“about”: [
{“@type”:”CreativeWork”,”name”:”Swapped”},
{“@type”:”CreativeWork”,”name”:”KPop Demon Hunters”},
{“@type”:”CreativeWork”,”name”:”The Sea Beast”} ],
“distribution”: {
“@type”: “DataDownload”,
“encodingFormat”: “JSON”,
“contentUrl”: “#cumulativeChart_6a16157529da6” }
}
document.addEventListener(‘DOMContentLoaded’, function () {
var ctx = document.getElementById(‘cumulativeChart_6a16157529da6’).getContext(‘2d’);
// Responsive sizing so the line chart doesn’t squash itself on
// narrow viewports. Right padding shrinks because the end-of-line
// pill labels also shrink; axis/title fonts scale to match the
// bar-graph scheme; ticks switch to compact notation on mobile.
var isMobile = window.innerWidth <= 768;
var isSmallMobile = window.innerWidth = 0; i–) {
if (data[i] !== null && data[i] !== undefined) {
return context.dataIndex === i;
}
}
return false;
},
formatter: function (value, context) {
return context.dataset.label;
}
}
},
scales: {
x: {
title: {
display: true,
text: ‘Week Number’,
font: {
size: axisTitleFontSize
}
},
type: ‘linear’,
position: ‘bottom’,
ticks:{
stepSize: 1,
font: {
size: axisFontSize
}
}
},
y: {
title: {
display: true,
text: ‘Cumulative Views’,
font: {
size: axisTitleFontSize
}
},
beginAtZero: true,
ticks: {
font: { weight: ‘bold’, size: axisFontSize },
color: ‘#222’,
// Compact “1.2M” / “789K” on mobile so the y-axis
// doesn’t eat half the chart width with comma-
// separated numbers like “1,234,567,890”.
callback: function (value) {
if (window.wonCompactNumber) {
return window.wonCompactNumber(value, isMobile);
}
return value;
}
}
}
},
elements: {
line: {
tension: 0 // Disable bezier curves
}
}
}
});
});
/* Dark mode support for cumulative views chart – mobile only */
@media (prefers-color-scheme: dark) and (max-width: 768px) {
.netflix-data {
background-color: #ffffff;
padding: 20px;
border-radius: 8px;
box-shadow: 0 2px 10px rgba(0, 0, 0, 0.1);
}
.netflix-data canvas {
background-color: #ffffff;
}
}
4. Nemesis and Man on Fire Fates Still Up In The Air
Nemesis and Man on Fire are the two big recent scripted series on the English-language side. Both are vying for renewals, but neither has received an official green light just yet. Neither is a runaway smash hit, and both are riding awfully close to the line that led to The Waterfront getting canceled last year. We’re 50/50 on both but leaning more towards renewal on Man on Fire.
{
“@context”: “https://schema.org”,
“@type”: “Dataset”,
“name”: “Netflix Cumulative Views Over Time – The Waterfront – Season 1, Nemesis – Season 1, Man on Fire – Season 1, The Night Agent – Season 1 and UNTAMED – Season 1 (6-week trend)”,
“description”: “Week-by-week cumulative views trend for The Waterfront – Season 1, Nemesis – Season 1, Man on Fire – Season 1, The Night Agent – Season 1 and UNTAMED – Season 1 on Netflix across 6 weeks. The Night Agent – Season 1 finishes the period with the highest cumulative count at 85,400,000 views. Combined final total: 245,400,000 views. Data sourced from Netflix’s official Top 10 engagement reports.”,
“license”: “https://www.whats-on-netflix.com/corrections-policy/”,
“keywords”: “Netflix, cumulative views, viewership trend, Netflix Top 10, weekly views, time series, The Waterfront – Season 1, Nemesis – Season 1, Man on Fire – Season 1, The Night Agent – Season 1, UNTAMED – Season 1”,
“creator”: {
“@type”: “Organization”,
“name”: “What’s on Netflix”,
“url”: “https://www.whats-on-netflix.com/”
},
“publisher”: {
“@type”: “Organization”,
“name”: “What’s on Netflix”,
“url”: “https://www.whats-on-netflix.com/”
},
“datePublished”: “2026-05-26”,
“dateModified”: “2026-05-26”,
“variableMeasured”: “Cumulative weekly views over time (Netflix Top 10)”,
“measurementTechnique”: “Running totals derived from Netflix’s official weekly Top 10 engagement reports”,
“temporalCoverage”: “6 weeks”,
“spatialCoverage”: “Global”,
“isAccessibleForFree”: true,
“about”: [
{“@type”:”CreativeWork”,”name”:”The Waterfront – Season 1″},
{“@type”:”CreativeWork”,”name”:”Nemesis – Season 1″},
{“@type”:”CreativeWork”,”name”:”Man on Fire – Season 1″},
{“@type”:”CreativeWork”,”name”:”The Night Agent – Season 1″},
{“@type”:”CreativeWork”,”name”:”UNTAMED – Season 1″} ],
“distribution”: {
“@type”: “DataDownload”,
“encodingFormat”: “JSON”,
“contentUrl”: “#cumulativeChart_6a16157529e0d” }
}
document.addEventListener(‘DOMContentLoaded’, function () {
var ctx = document.getElementById(‘cumulativeChart_6a16157529e0d’).getContext(‘2d’);
// Responsive sizing so the line chart doesn’t squash itself on
// narrow viewports. Right padding shrinks because the end-of-line
// pill labels also shrink; axis/title fonts scale to match the
// bar-graph scheme; ticks switch to compact notation on mobile.
var isMobile = window.innerWidth <= 768;
var isSmallMobile = window.innerWidth = 0; i–) {
if (data[i] !== null && data[i] !== undefined) {
return context.dataIndex === i;
}
}
return false;
},
formatter: function (value, context) {
return context.dataset.label;
}
}
},
scales: {
x: {
title: {
display: true,
text: ‘Week Number’,
font: {
size: axisTitleFontSize
}
},
type: ‘linear’,
position: ‘bottom’,
ticks:{
stepSize: 1,
font: {
size: axisFontSize
}
}
},
y: {
title: {
display: true,
text: ‘Cumulative Views’,
font: {
size: axisTitleFontSize
}
},
beginAtZero: true,
ticks: {
font: { weight: ‘bold’, size: axisFontSize },
color: ‘#222’,
// Compact “1.2M” / “789K” on mobile so the y-axis
// doesn’t eat half the chart width with comma-
// separated numbers like “1,234,567,890”.
callback: function (value) {
if (window.wonCompactNumber) {
return window.wonCompactNumber(value, isMobile);
}
return value;
}
}
}
},
elements: {
line: {
tension: 0 // Disable bezier curves
}
}
}
});
});
/* Dark mode support for cumulative views chart – mobile only */
@media (prefers-color-scheme: dark) and (max-width: 768px) {
.netflix-data {
background-color: #ffffff;
padding: 20px;
border-radius: 8px;
box-shadow: 0 2px 10px rgba(0, 0, 0, 0.1);
}
.netflix-data canvas {
background-color: #ffffff;
}
}
5. Kylie Minogue Isn’t A Global Star
Netflix’s big documentary series on Kylie Minogue received a massive press push in recent weeks, but with just 2.1M views and a #10 finish in its opening week, it opened significantly weaker than most other Wednesday celebrity/music docuseries in recent years.
{
“@context”: “https://schema.org”,
“@type”: “Dataset”,
“name”: “Netflix Viewership Comparison – aka Charlie Sheen, Arnold, Martha, WHAM!, Return of the King: The Fall and Rise of Elvis Presley and 1 more Netflix title (1-week cumulative views)”,
“description”: “Cumulative weekly views for aka Charlie Sheen, Arnold, Martha, WHAM!, Return of the King: The Fall and Rise of Elvis Presley and 1 more Netflix title on Netflix over 1 weeks. aka Charlie Sheen leads the comparison with 9,700,000 cumulative views. Combined total: 33,300,000 views. Data sourced from Netflix’s official Top 10 engagement reports.”,
“license”: “https://www.whats-on-netflix.com/corrections-policy/”,
“keywords”: “Netflix, viewership, streaming data, Netflix Top 10, weekly views, audience metrics, aka Charlie Sheen, Arnold, Martha, WHAM!, Return of the King: The Fall and Rise of Elvis Presley, Kylie”,
“creator”: {
“@type”: “Organization”,
“name”: “What’s on Netflix”,
“url”: “https://www.whats-on-netflix.com/”
},
“publisher”: {
“@type”: “Organization”,
“name”: “What’s on Netflix”,
“url”: “https://www.whats-on-netflix.com/”
},
“datePublished”: “2026-05-26”,
“dateModified”: “2026-05-26”,
“variableMeasured”: “Cumulative weekly views (Netflix Top 10)”,
“measurementTechnique”: “Aggregation of Netflix’s official weekly Top 10 engagement reports”,
“temporalCoverage”: “1 weeks”,
“spatialCoverage”: “Global”,
“isAccessibleForFree”: true,
“about”: [
{“@type”:”CreativeWork”,”name”:”aka Charlie Sheen”},
{“@type”:”CreativeWork”,”name”:”Arnold”},
{“@type”:”CreativeWork”,”name”:”Martha”},
{“@type”:”CreativeWork”,”name”:”WHAM!”},
{“@type”:”CreativeWork”,”name”:”Return of the King: The Fall and Rise of Elvis Presley”},
{“@type”:”CreativeWork”,”name”:”Kylie”} ],
“distribution”: {
“@type”: “DataDownload”,
“encodingFormat”: “JSON”,
“contentUrl”: “#netflix_bar_graph_6a16157529e9e” }
}
(function() {
var showLabels = true;
var titleHighlight = “Kylie”;
// Title rendered above the chart in place of the legend (1 week → “Opening Week”).
var chartTitle = “Opening Week Views”;
function loadScript(src, callback) {
var script = document.createElement(‘script’);
script.src = src;
script.onload = callback;
document.head.appendChild(script);
}
function createChart() {
var canvasEl = document.getElementById(‘netflix_bar_graph_6a16157529e9e’);
var ctx = canvasEl.getContext(‘2d’);
// Detect mobile screen size
var isMobile = window.innerWidth <= 768;
var isSmallMobile = window.innerWidth 0) {
var perTitle = isSmallMobile ? 38 : (isMobile ? 44 : 50);
var basePad = isSmallMobile ? 80 : (isMobile ? 90 : 100);
var targetH = titleCount * perTitle + basePad;
canvasEl.height = targetH;
canvasEl.style.height = targetH + ‘px’;
}
var chartConfig = {
type: ‘bar’,
data: {
labels: [“aka Charlie Sheen”,”Arnold”,”Martha”,”WHAM!”,”Return of the King: The Fall and Rise of Elvis Presley”,”Kylie”],
datasets: [{
label: chartTitle,
data: [9700000,7700000,6100000,4400000,3300000,2100000],
backgroundColor: [“#b9090b”,”#b9090b”,”#b9090b”,”#b9090b”,”#b9090b”,”#000″],
borderColor: [“#b9090b”,”#b9090b”,”#b9090b”,”#b9090b”,”#b9090b”,”#000″],
borderWidth: 0,
hoverBackgroundColor: [“#8a0708″,”#8a0708″,”#8a0708″,”#8a0708″,”#8a0708″,”#1a1a1a”],
hoverBorderColor: ‘#b9090b’,
hoverBorderWidth: 2,
barPercentage: 0.9,
categoryPercentage: 0.9
}]
},
options: {
responsive: true,
maintainAspectRatio: false,
indexAxis: ‘y’,
layout: {
padding: { bottom: isMobile ? 12 : 24, top: 8 }
},
plugins: {
title: {
display: true,
text: chartTitle,
color: ‘#000000’,
align: ‘start’,
font: {
size: titleFontSize,
weight: ‘bold’
},
padding: { top: 4, bottom: 16 }
},
legend: { display: false },
tooltip: {
backgroundColor: ‘#221f1f’,
titleColor: ‘#b9090b’,
bodyColor: ‘#ffffff’,
titleFont: { weight: ‘bold’, size: 13 },
bodyFont: { size: 13 },
padding: { top: 10, bottom: 10, left: 14, right: 14 },
cornerRadius: 6,
displayColors: false,
borderColor: ‘#b9090b’,
borderWidth: 1,
callbacks: {
label: function(context) {
return context.dataset.label + ‘: ‘ + context.parsed.x.toLocaleString();
}
}
}
},
scales: {
x: {
beginAtZero: true,
ticks: {
font: {
size: axisFontSize
},
// Compact “1.2M” / “789K” ticks on mobile so the
// x-axis doesn’t eat half the chart width.
callback: function (value) {
if (window.wonCompactNumber) {
return window.wonCompactNumber(value, isMobile);
}
return value;
}
}
},
y: {
ticks: {
// Bold + brand-red color for the highlighted title’s y-axis tick;
// muted gray for everything else when a highlight is active.
font: function (context) {
var label = context.tick && context.tick.label;
if (titleHighlight && label === titleHighlight) {
return { weight: ‘bold’, size: axisFontSize };
}
return { size: axisFontSize };
},
color: function (context) {
var label = context.tick && context.tick.label;
if (titleHighlight && label === titleHighlight) {
return ‘#b9090b’;
}
return ‘#000000’;
}
}
}
},
}
};
// Add DataLabels configuration if labels are enabled
if (showLabels && window.ChartDataLabels) {
// Small bars (< 15% of max) get their label floated *above* the bar
// tip in Netflix red, so it never overlaps the red bar and never
// becomes black-on-red. A white text stroke keeps the label
// readable even when the chart sits on a coloured/image background.
var isSmallBar = function(context) {
var value = context.dataset.data[context.dataIndex];
if (typeof value === 'undefined' || value === null) return false;
var maxValue = Math.max.apply(null, context.dataset.data.filter(function(v) {
return v !== null && v !== undefined;
}));
if (!maxValue) return false;
return (value / maxValue) * 100 < 15;
};
chartConfig.options.plugins.datalabels = {
anchor: function(context) {
return isSmallBar(context) ? 'end' : 'center';
},
align: function(context) {
return isSmallBar(context) ? 'end' : 'center';
},
offset: function(context) {
return isSmallBar(context) ? 4 : 0;
},
color: function(context) {
return isSmallBar(context) ? '#b9090b' : '#fff';
},
textStrokeColor: function(context) {
return isSmallBar(context) ? '#ffffff' : 'rgba(0,0,0,0.35)';
},
textStrokeWidth: 2,
clip: false,
clamp: true,
font: {
weight: 'bold',
size: dataLabelFontSize
},
formatter: function(value) {
if (window.wonCompactNumber) {
return window.wonCompactNumber(value, true);
}
return value;
},
display: function(context) {
var value = context.dataset.data[context.dataIndex];
return typeof value !== 'undefined' && value !== null;
}
};
chartConfig.plugins = [ChartDataLabels];
}
// Always register the watermark plugin (independent of data labels).
chartConfig.plugins = (chartConfig.plugins || []).concat(
window.wonWatermarkPlugin ? [window.wonWatermarkPlugin] : []
);
var chart = new Chart(ctx, chartConfig);
}
function ensureChartAndPlugin() {
if (!window.Chart) {
loadScript('https://cdn.jsdelivr.net/npm/chart.js@4.4.4/dist/chart.umd.min.js', function() {
ensureChartAndPlugin();
});
} else if (showLabels && !window.ChartDataLabels) {
loadScript('https://cdn.jsdelivr.net/npm/chartjs-plugin-datalabels@2.2.0', function() {
createChart();
});
} else {
createChart();
}
}
if (document.readyState === 'loading') {
document.addEventListener('DOMContentLoaded', ensureChartAndPlugin);
} else {
ensureChartAndPlugin();
}
})();
.sr-only {
position: absolute !important;
width: 1px !important;
height: 1px !important;
padding: 0 !important;
margin: -1px !important;
overflow: hidden !important;
clip: rect(0, 0, 0, 0) !important;
white-space: nowrap !important;
border: 0 !important;
}
.netflix-data-chart-container {
position: relative;
margin-bottom: 40px;
}
.netflix-data-chart-container table {
border-collapse: collapse;
width: 100%;
margin: 10px 0;
}
.netflix-data-chart-container th,
.netflix-data-chart-container td {
border: 1px solid #ddd;
padding: 8px;
text-align: left;
}
.netflix-data-chart-container th {
background-color: #f2f2f2;
font-weight: bold;
}
/* Dark mode support for netflix bar graph – mobile only */
@media (prefers-color-scheme: dark) and (max-width: 768px) {
.netflix-data-chart-container {
background-color: #ffffff;
padding: 20px;
border-radius: 8px;
box-shadow: 0 2px 10px rgba(0, 0, 0, 0.1);
}
.netflix-data-chart-container canvas {
background-color: #ffffff;
}
.netflix-data-chart-container table {
background-color: #ffffff;
}
.netflix-data-chart-container th,
.netflix-data-chart-container td {
background-color: #ffffff;
color: #333333;
border: 1px solid #ddd;
}
.netflix-data-chart-container th {
background-color: #f2f2f2;
color: #333333;
}
}
/* Additional dark mode support for better contrast – mobile only */
@media (prefers-color-scheme: dark) and (max-width: 768px) {
.netflix-data-chart-container .sr-only {
color: #333333;
}
}
/* Mobile responsive font sizes */
@media (max-width: 768px) {
.netflix-data-chart-container canvas {
font-size: 12px !important;
}
}
@media (max-width: 480px) {
.netflix-data-chart-container canvas {
font-size: 10px !important;
}
}
What’s fascinating about this docuseries, however, is that Kylie’s popularity is heavily concentrated in select countries. She performed well in Australia and New Zealand (obviously, given that’s where she’s from), followed by the UK, which she has called home for most of her career. From there, we can see her appeal also translates well in the Nordics and Eastern Europe. Elsewhere, however, the docuseries was a complete no-show.
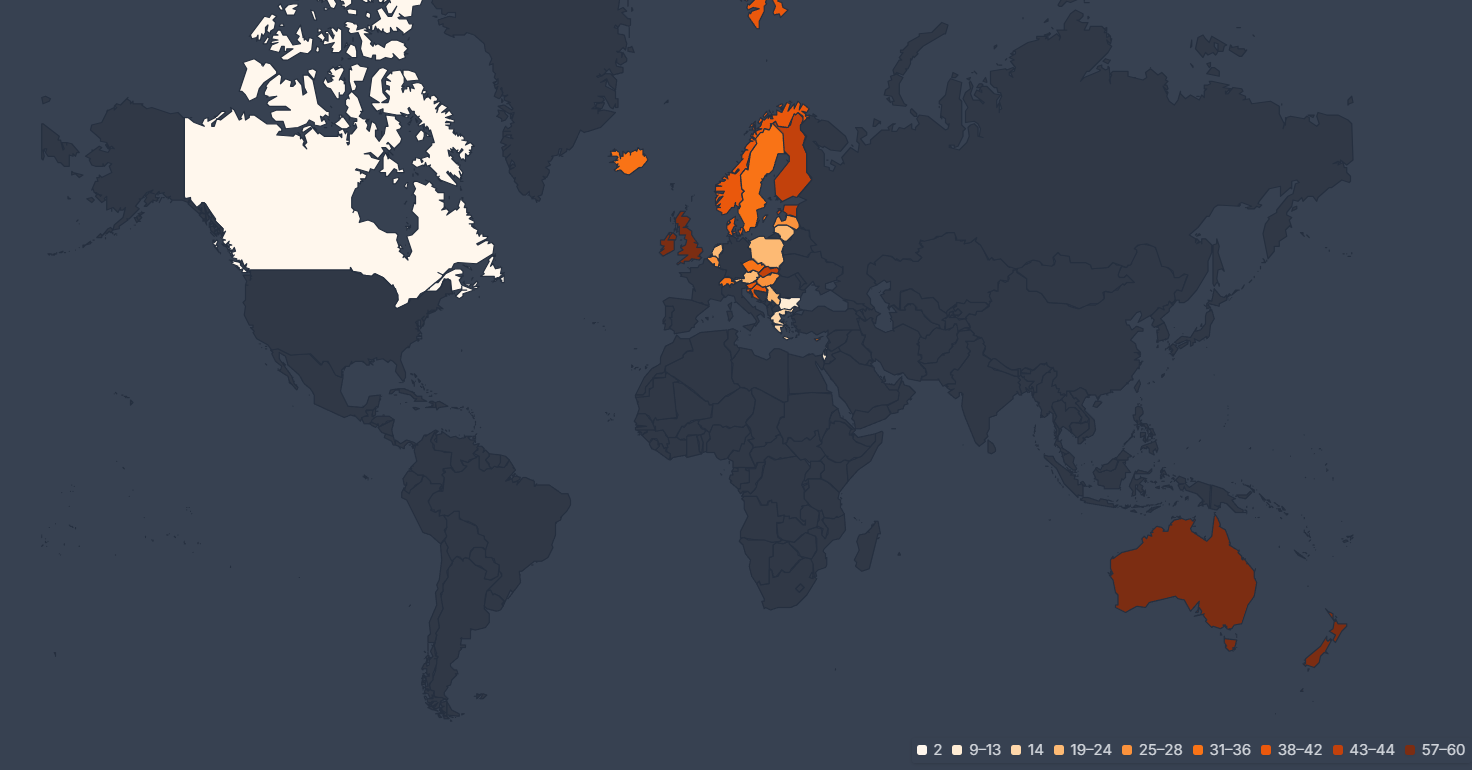
Picture Credit: FlixPatrol
6. Berlin and the Lady with an Ermine in Week 2
Once again, we come back to something we’ve said over and over: nine times out of ten, the opening few days are the most important. Dominating the charts for most of its first full week on Netflix (and its second week in the top 10s), Berlin season 2 is performing well compared to nearly every other Spanish show. But when stacked up against the first season of Berlin—which had a blistering start back in 2023—it’s still down 50%. The good news? That first season, now renamed to Berlin and the Jewels of Paris, reappeared in the top 10s, proving audiences are still heavily invested in the Money Heist universe.
{
“@context”: “https://schema.org”,
“@type”: “Dataset”,
“name”: “Netflix Cumulative Views Over Time – Berlin and the Lady with an Ermine and Berlin – Season 1 (5-week trend)”,
“description”: “Week-by-week cumulative views trend for Berlin and the Lady with an Ermine and Berlin – Season 1 on Netflix across 5 weeks. Berlin – Season 1 finishes the period with the highest cumulative count at 50,100,000 views. Combined final total: 66,600,000 views. Data sourced from Netflix’s official Top 10 engagement reports.”,
“license”: “https://www.whats-on-netflix.com/corrections-policy/”,
“keywords”: “Netflix, cumulative views, viewership trend, Netflix Top 10, weekly views, time series, Berlin and the Lady with an Ermine, Berlin – Season 1”,
“creator”: {
“@type”: “Organization”,
“name”: “What’s on Netflix”,
“url”: “https://www.whats-on-netflix.com/”
},
“publisher”: {
“@type”: “Organization”,
“name”: “What’s on Netflix”,
“url”: “https://www.whats-on-netflix.com/”
},
“datePublished”: “2026-05-26”,
“dateModified”: “2026-05-26”,
“variableMeasured”: “Cumulative weekly views over time (Netflix Top 10)”,
“measurementTechnique”: “Running totals derived from Netflix’s official weekly Top 10 engagement reports”,
“temporalCoverage”: “5 weeks”,
“spatialCoverage”: “Global”,
“isAccessibleForFree”: true,
“about”: [
{“@type”:”CreativeWork”,”name”:”Berlin and the Lady with an Ermine”},
{“@type”:”CreativeWork”,”name”:”Berlin – Season 1″} ],
“distribution”: {
“@type”: “DataDownload”,
“encodingFormat”: “JSON”,
“contentUrl”: “#cumulativeChart_6a16157529edd” }
}
document.addEventListener(‘DOMContentLoaded’, function () {
var ctx = document.getElementById(‘cumulativeChart_6a16157529edd’).getContext(‘2d’);
// Responsive sizing so the line chart doesn’t squash itself on
// narrow viewports. Right padding shrinks because the end-of-line
// pill labels also shrink; axis/title fonts scale to match the
// bar-graph scheme; ticks switch to compact notation on mobile.
var isMobile = window.innerWidth <= 768;
var isSmallMobile = window.innerWidth = 0; i–) {
if (data[i] !== null && data[i] !== undefined) {
return context.dataIndex === i;
}
}
return false;
},
formatter: function (value, context) {
return context.dataset.label;
}
}
},
scales: {
x: {
title: {
display: true,
text: ‘Week Number’,
font: {
size: axisTitleFontSize
}
},
type: ‘linear’,
position: ‘bottom’,
ticks:{
stepSize: 1,
font: {
size: axisFontSize
}
}
},
y: {
title: {
display: true,
text: ‘Cumulative Views’,
font: {
size: axisTitleFontSize
}
},
beginAtZero: true,
ticks: {
font: { weight: ‘bold’, size: axisFontSize },
color: ‘#222’,
// Compact “1.2M” / “789K” on mobile so the y-axis
// doesn’t eat half the chart width with comma-
// separated numbers like “1,234,567,890”.
callback: function (value) {
if (window.wonCompactNumber) {
return window.wonCompactNumber(value, isMobile);
}
return value;
}
}
}
},
elements: {
line: {
tension: 0 // Disable bezier curves
}
}
}
});
});
/* Dark mode support for cumulative views chart – mobile only */
@media (prefers-color-scheme: dark) and (max-width: 768px) {
.netflix-data {
background-color: #ffffff;
padding: 20px;
border-radius: 8px;
box-shadow: 0 2px 10px rgba(0, 0, 0, 0.1);
}
.netflix-data canvas {
background-color: #ffffff;
}
}
7. The WONDERfools Gets Nearly 200% Boost in Week 2
Last week, we caught some flak for suggesting that The WONDERfools received a significant marketing push. It’s a difficult metric to quantify, and while we acknowledge that everyone’s social feeds behave differently, we do track the majority of Netflix’s press releases and social output, so we’ll just have to agree to disagree! We brought it up because the K-drama had a slightly underwhelming first week, but its second week bounced back decently with 7.9M views.
Compared to other complete K-drama drops released on a Friday, it’s now firmly ranked among the middle performers in the category.
{
“@context”: “https://schema.org”,
“@type”: “Dataset”,
“name”: “Netflix Weekly Views Breakdown – My Name, Hierarchy, The Trauma Code: Heroes on Call, Parasyte: The Grey, The Art of Sarah and 14 more Netflix titles (2-week stacked view)”,
“description”: “Weekly views breakdown for My Name, Hierarchy, The Trauma Code: Heroes on Call, Parasyte: The Grey, The Art of Sarah and 14 more Netflix titles on Netflix over 2 weeks, with each bar segmented by individual week. My Name leads the comparison with 19,000,000 cumulative views. Combined total: 215,900,000 views. Data sourced from Netflix’s official Top 10 engagement reports.”,
“license”: “https://www.whats-on-netflix.com/corrections-policy/”,
“keywords”: “Netflix, views, weekly breakdown, streaming data, Netflix Top 10, stacked bar chart, My Name, Hierarchy, The Trauma Code: Heroes on Call, Parasyte: The Grey, The Art of Sarah, Can This Love Be Translated?, Narco-Saints, The Silent Sea”,
“creator”: {
“@type”: “Organization”,
“name”: “What’s on Netflix”,
“url”: “https://www.whats-on-netflix.com/”
},
“publisher”: {
“@type”: “Organization”,
“name”: “What’s on Netflix”,
“url”: “https://www.whats-on-netflix.com/”
},
“datePublished”: “2026-05-26”,
“dateModified”: “2026-05-26”,
“variableMeasured”: “Weekly views by title and week (Netflix Top 10)”,
“measurementTechnique”: “Per-week values from Netflix’s official weekly Top 10 engagement reports”,
“temporalCoverage”: “2 weeks”,
“spatialCoverage”: “Global”,
“isAccessibleForFree”: true,
“about”: [
{“@type”:”CreativeWork”,”name”:”My Name”},
{“@type”:”CreativeWork”,”name”:”Hierarchy”},
{“@type”:”CreativeWork”,”name”:”The Trauma Code: Heroes on Call”},
{“@type”:”CreativeWork”,”name”:”Parasyte: The Grey”},
{“@type”:”CreativeWork”,”name”:”The Art of Sarah”},
{“@type”:”CreativeWork”,”name”:”Can This Love Be Translated?”},
{“@type”:”CreativeWork”,”name”:”Narco-Saints”},
{“@type”:”CreativeWork”,”name”:”The Silent Sea”},
{“@type”:”CreativeWork”,”name”:”The WONDERfools”},
{“@type”:”CreativeWork”,”name”:”If Wishes Could Kill”} ],
“distribution”: {
“@type”: “DataDownload”,
“encodingFormat”: “JSON”,
“contentUrl”: “#netflix_split_bar_6a16157529f71” }
}
(function () {
var showLabels = true;
var titleHighlight = “The WONDERfools”;
function loadScript(src, callback) {
var script = document.createElement(‘script’);
script.src = src;
script.onload = callback;
document.head.appendChild(script);
}
function createChart() {
var canvasEl = document.getElementById(‘netflix_split_bar_6a16157529f71’);
var ctx = canvasEl.getContext(‘2d’);
var isMobile = window.innerWidth <= 768;
var isSmallMobile = window.innerWidth 0) {
var perTitle = isSmallMobile ? 38 : (isMobile ? 44 : 50);
var basePad = isSmallMobile ? 90 : (isMobile ? 100 : 100);
var targetH = titleCount * perTitle + basePad;
canvasEl.height = targetH;
canvasEl.style.height = targetH + ‘px’;
}
var chartConfig = {
type: ‘bar’,
data: {
labels: [“My Name”,”Hierarchy”,”The Trauma Code: Heroes on Call”,”Parasyte: The Grey”,”The Art of Sarah”,”Can This Love Be Translated?”,”Narco-Saints”,”The Silent Sea”,”The WONDERfools”,”If Wishes Could Kill”,”Mask Girl”,”As You Stood By”,”Cashero”,”Karma”,”Trigger”,”The Price of Confession”,”Boyfriend on Demand”,”Doona!”,”Dear Hongrang”],
datasets: [{“label”:”Week 1″,”data”:[6300000,7600000,4700000,6300000,3800000,4000000,3200000,3700000,2700000,2800000,2800000,2300000,3800000,3600000,2900000,2200000,2600000,2800000,2200000],”backgroundColor”:[“#b9090bCC”,”#b9090bCC”,”#b9090bCC”,”#b9090bCC”,”#b9090bCC”,”#b9090bCC”,”#b9090bCC”,”#b9090bCC”,”#b9090b”,”#b9090bCC”,”#b9090bCC”,”#b9090bCC”,”#b9090bCC”,”#b9090bCC”,”#b9090bCC”,”#b9090bCC”,”#b9090bCC”,”#b9090bCC”,”#b9090bCC”],”borderWidth”:0,”barPercentage”:0.90000000000000002220446049250313080847263336181640625,”categoryPercentage”:0.90000000000000002220446049250313080847263336181640625},{“label”:”Week 2″,”data”:[12700000,9500000,11900000,9800000,10000000,9000000,9800000,7900000,7900000,7500000,7400000,7800000,6100000,4800000,5000000,5700000,4800000,4500000,3500000],”backgroundColor”:[“#900608CC”,”#900608CC”,”#900608CC”,”#900608CC”,”#900608CC”,”#900608CC”,”#900608CC”,”#900608CC”,”#900608″,”#900608CC”,”#900608CC”,”#900608CC”,”#900608CC”,”#900608CC”,”#900608CC”,”#900608CC”,”#900608CC”,”#900608CC”,”#900608CC”],”borderWidth”:0,”barPercentage”:0.90000000000000002220446049250313080847263336181640625,”categoryPercentage”:0.90000000000000002220446049250313080847263336181640625}] },
options: {
responsive: true,
maintainAspectRatio: false,
indexAxis: ‘y’,
layout: {
padding: { bottom: isMobile ? 12 : 24, top: 8 }
},
plugins: {
legend: {
display: true,
position: ‘top’,
labels: {
font: { size: legendFontSize },
padding: 12,
boxWidth: 14,
boxHeight: 14
}
},
tooltip: {
backgroundColor: ‘#221f1f’,
titleColor: ‘#b9090b’,
bodyColor: ‘#ffffff’,
footerColor: ‘#cccccc’,
titleFont: { weight: ‘bold’, size: 13 },
bodyFont: { size: 13 },
footerFont: { size: 12, weight: ‘normal’ },
padding: { top: 10, bottom: 10, left: 14, right: 14 },
cornerRadius: 6,
displayColors: true,
borderColor: ‘#b9090b’,
borderWidth: 1,
callbacks: {
label: function (context) {
return context.dataset.label + ‘: ‘ + Number(context.parsed.x).toLocaleString() + ‘ views’;
},
footer: function (items) {
if (!items || !items.length) return ”;
var idx = items[0].dataIndex;
var total = 0;
var datasets = items[0].chart.data.datasets;
for (var i = 0; i < datasets.length; i++) {
total += (datasets[i].data[idx] || 0);
}
return 'Total: ' + total.toLocaleString();
}
}
}
},
scales: {
x: {
beginAtZero: true,
stacked: true,
ticks: {
font: { size: axisFontSize },
callback: function (value) {
if (window.wonCompactNumber) {
return window.wonCompactNumber(value, isMobile);
}
return value;
}
},
grid: { color: 'rgba(0,0,0,0.05)' }
},
y: {
stacked: true,
ticks: {
// Bold + brand-red color for the highlighted title's y-axis tick;
// muted gray for everything else when a highlight is active.
font: function (context) {
var label = context.tick && context.tick.label;
if (titleHighlight && label === titleHighlight) {
return { weight: 'bold', size: axisFontSize };
}
return { size: axisFontSize };
},
color: function (context) {
var label = context.tick && context.tick.label;
if (titleHighlight && label === titleHighlight) {
return '#b9090b';
}
return '#000000';
}
},
grid: { display: false }
}
}
}
};
if (showLabels && window.ChartDataLabels) {
chartConfig.options.plugins.datalabels = {
anchor: 'center',
align: 'center',
color: '#ffffff',
textStrokeColor: 'rgba(0,0,0,0.4)',
textStrokeWidth: 2,
font: { weight: 'bold', size: dataLabelFontSize },
formatter: function (value) {
if (!value) return '';
if (window.wonCompactNumber) {
return window.wonCompactNumber(value, true);
}
return value;
},
display: function (context) {
// Suppress labels on segments smaller than ~8% of the bar
// so cramped segments stay clean. Tooltips still show the
// exact value on hover.
var value = context.dataset.data[context.dataIndex];
if (typeof value === 'undefined' || value === null || value === 0) return false;
var idx = context.dataIndex;
var total = 0;
var datasets = context.chart.data.datasets;
for (var i = 0; i 0 && (value / total) > 0.08;
}
};
chartConfig.plugins = [ChartDataLabels];
}
chartConfig.plugins = (chartConfig.plugins || []).concat(
window.wonWatermarkPlugin ? [window.wonWatermarkPlugin] : []
);
new Chart(ctx, chartConfig);
}
function ensureChartAndPlugin() {
if (!window.Chart) {
loadScript(‘https://cdn.jsdelivr.net/npm/chart.js@4.4.4/dist/chart.umd.min.js’, ensureChartAndPlugin);
} else if (showLabels && !window.ChartDataLabels) {
loadScript(‘https://cdn.jsdelivr.net/npm/chartjs-plugin-datalabels@2.2.0’, createChart);
} else {
createChart();
}
}
if (document.readyState === ‘loading’) {
document.addEventListener(‘DOMContentLoaded’, ensureChartAndPlugin);
} else {
ensureChartAndPlugin();
}
})();
.netflix-data-chart-container {
position: relative;
margin-bottom: 40px;
}
.netflix-data-chart-container .sr-only {
position: absolute !important;
width: 1px !important;
height: 1px !important;
padding: 0 !important;
margin: -1px !important;
overflow: hidden !important;
clip: rect(0, 0, 0, 0) !important;
white-space: nowrap !important;
border: 0 !important;
}
@media (prefers-color-scheme: dark) and (max-width: 768px) {
.netflix-data-chart-container {
background-color: #ffffff;
padding: 20px;
border-radius: 8px;
box-shadow: 0 2px 10px rgba(0, 0, 0, 0.1);
}
.netflix-data-chart-container canvas {
background-color: #ffffff;
}
}
8. English Movie Check-Ins
Apex and Remarkably Bright Creatures are still featured in the top 10s this week, with the former dropping 36% and the latter plummeting nearly 60%. Let’s plot them on the chart to see how well they’re performing against other 2026 movies. Apex is now putting a bit of distance between itself and The Rip, but it’s ultimately War Machine that remains the biggest movie of the year so far. Remarkably Bright Creatures is now sitting firmly behind the year’s top performers.
{
“@context”: “https://schema.org”,
“@type”: “Dataset”,
“name”: “Netflix Cumulative Views Over Time – Remarkably Bright Creatures, Apex, The Rip, War Machine, Peaky Blinders: The Immortal Man and 2 more Netflix titles (6-week trend)”,
“description”: “Week-by-week cumulative views trend for Remarkably Bright Creatures, Apex, The Rip, War Machine, Peaky Blinders: The Immortal Man and 2 more Netflix titles on Netflix across 6 weeks. War Machine finishes the period with the highest cumulative count at 121,700,000 views. Combined final total: 556,600,000 views. Data sourced from Netflix’s official Top 10 engagement reports.”,
“license”: “https://www.whats-on-netflix.com/corrections-policy/”,
“keywords”: “Netflix, cumulative views, viewership trend, Netflix Top 10, weekly views, time series, Remarkably Bright Creatures, Apex, The Rip, War Machine, Peaky Blinders: The Immortal Man, Roommates, Swapped”,
“creator”: {
“@type”: “Organization”,
“name”: “What’s on Netflix”,
“url”: “https://www.whats-on-netflix.com/”
},
“publisher”: {
“@type”: “Organization”,
“name”: “What’s on Netflix”,
“url”: “https://www.whats-on-netflix.com/”
},
“datePublished”: “2026-05-26”,
“dateModified”: “2026-05-26”,
“variableMeasured”: “Cumulative weekly views over time (Netflix Top 10)”,
“measurementTechnique”: “Running totals derived from Netflix’s official weekly Top 10 engagement reports”,
“temporalCoverage”: “6 weeks”,
“spatialCoverage”: “Global”,
“isAccessibleForFree”: true,
“about”: [
{“@type”:”CreativeWork”,”name”:”Remarkably Bright Creatures”},
{“@type”:”CreativeWork”,”name”:”Apex”},
{“@type”:”CreativeWork”,”name”:”The Rip”},
{“@type”:”CreativeWork”,”name”:”War Machine”},
{“@type”:”CreativeWork”,”name”:”Peaky Blinders: The Immortal Man”},
{“@type”:”CreativeWork”,”name”:”Roommates”},
{“@type”:”CreativeWork”,”name”:”Swapped”} ],
“distribution”: {
“@type”: “DataDownload”,
“encodingFormat”: “JSON”,
“contentUrl”: “#cumulativeChart_6a16157529fd2” }
}
document.addEventListener(‘DOMContentLoaded’, function () {
var ctx = document.getElementById(‘cumulativeChart_6a16157529fd2’).getContext(‘2d’);
// Responsive sizing so the line chart doesn’t squash itself on
// narrow viewports. Right padding shrinks because the end-of-line
// pill labels also shrink; axis/title fonts scale to match the
// bar-graph scheme; ticks switch to compact notation on mobile.
var isMobile = window.innerWidth <= 768;
var isSmallMobile = window.innerWidth = 0; i–) {
if (data[i] !== null && data[i] !== undefined) {
return context.dataIndex === i;
}
}
return false;
},
formatter: function (value, context) {
return context.dataset.label;
}
}
},
scales: {
x: {
title: {
display: true,
text: ‘Week Number’,
font: {
size: axisTitleFontSize
}
},
type: ‘linear’,
position: ‘bottom’,
ticks:{
stepSize: 1,
font: {
size: axisFontSize
}
}
},
y: {
title: {
display: true,
text: ‘Cumulative Views’,
font: {
size: axisTitleFontSize
}
},
beginAtZero: true,
ticks: {
font: { weight: ‘bold’, size: axisFontSize },
color: ‘#222’,
// Compact “1.2M” / “789K” on mobile so the y-axis
// doesn’t eat half the chart width with comma-
// separated numbers like “1,234,567,890”.
callback: function (value) {
if (window.wonCompactNumber) {
return window.wonCompactNumber(value, isMobile);
}
return value;
}
}
}
},
elements: {
line: {
tension: 0 // Disable bezier curves
}
}
}
});
});
/* Dark mode support for cumulative views chart – mobile only */
@media (prefers-color-scheme: dark) and (max-width: 768px) {
.netflix-data {
background-color: #ffffff;
padding: 20px;
border-radius: 8px;
box-shadow: 0 2px 10px rgba(0, 0, 0, 0.1);
}
.netflix-data canvas {
background-color: #ffffff;
}
}
Full List of Netflix Top 10s For Week Ending May 24th
English TV
| Rank | Title | Hours | Views | Week # |
|---|---|---|---|---|
| 1 | Nemesis: Season 1 | 88,900,000 (61.64%) | 11,400,000 | 2 |
| 2 | The Boroughs: Season 1 | 35,300,000 | 5,600,000 | 1 |
| 3 | Worst Ex Ever: Season 2 | 14,600,000 (-55.21%) | 3,600,000 | 3 |
| 4 | The Roast of Kevin Hart | 9,000,000 (-76.68%) | 3,100,000 | 2 |
| 5 | Man on Fire: Season 1 | 16,800,000 (-44.55%) | 3,000,000 | 4 |
| 6 | Legends: Season 1 | 17,400,000 (-55.04%) | 2,900,000 | 3 |
| 7 | Raw: May 18, 2026 | 4,600,000 (-4.17%) | 2,600,000 | 1 |
| 8 | Perfect Match: Season 4 | 17,100,000 (51.33%) | 2,400,000 | 2 |
| 9 | Devil May Cry: Season 2 | 10,800,000 (-44.33%) | 2,300,000 | 2 |
| 10 | Kylie: Limited Series | 6,400,000 | 2,100,000 | 1 |
English Film
| Rank | Title | Hours | Views | Week # |
|---|---|---|---|---|
| 1 | The Crash | 43,700,000 (136.22%) | 27,600,000 | 2 |
| 2 | Swapped | 27,400,000 (-38.84%) | 16,100,000 | 4 |
| 3 | Ladies First | 18,500,000 | 11,900,000 | 1 |
| 4 | Goat | 16,900,000 (9.74%) | 10,100,000 | 2 |
| 5 | Remarkably Bright Creatures | 15,600,000 (-59.59%) | 8,200,000 | 3 |
| 6 | Apex | 10,600,000 (-36.90%) | 6,700,000 | 5 |
| 7 | Stolen Baby: The Murder of Heidi Broussard | 7,700,000 (83.33%) | 5,300,000 | 2 |
| 8 | In Her Shoes | 11,200,000 | 5,100,000 | 1 |
| 9 | No Hard Feelings | 8,200,000 | 4,700,000 | 3 |
| 10 | KPop Demon Hunters | 6,400,000 (0.00%) | 3,800,000 | 49 |
Non-English TV
| Rank | Title | Hours | Views | Week # |
|---|---|---|---|---|
| 1 | Berlin and the Lady with an Ermine: Limited Series | 76,300,000 (65.51%) | 10,300,000 | 2 |
| 2 | The WONDERfools: Limited Series | 74,800,000 (195.65%) | 7,900,000 | 2 |
| 3 | My Royal Nemesis: Limited Series | 28,400,000 (17.36%) | 4,100,000 | 3 |
| 4 | Sold Out on You: Limited Series | 24,900,000 (1.63%) | 2,200,000 | 5 |
| 5 | Between Father and Son: Season 1 | 6,100,000 (-57.04%) | 2,200,000 | 2 |
| 6 | Desi Bling: Season 1 | 10,400,000 | 2,100,000 | 1 |
| 7 | The Chestnut Man: Hide and Seek | 8,000,000 (-52.10%) | 1,600,000 | 3 |
| 8 | Berlin and the Jewels of Paris: Limited Series | 8,800,000 | 1,300,000 | 8 |
| 9 | James.: Limited Series | 2,700,000 | 1,100,000 | 1 |
| 10 | If Wishes Could Kill: Limited Series | 6,100,000 (-44.04%) | 1,000,000 | 5 |
Non-English Film
| Rank | Title | Hours | Views | Week # |
|---|---|---|---|---|
| 1 | KARTAVYA | 7,700,000 (-10.47%) | 4,200,000 | 2 |
| 2 | Bride of the Year | 4,100,000 (7.89%) | 2,500,000 | 2 |
| 3 | Coco Before Chanel | 3,200,000 | 1,700,000 | 1 |
| 4 | The Bus: A French Football Mutiny | 2,000,000 (-31.03%) | 1,500,000 | 2 |
| 5 | Dhurandhar The Revenge (Raw & Undekha) | 4,900,000 (-27.94%) | 1,300,000 | 2 |
| 6 | Number One | 1,900,000 | 1,100,000 | 1 |
| 7 | My Dearest Assassin | 2,300,000 (-82.84%) | 1,100,000 | 3 |
| 8 | Je m’appelle Agneta | 1,800,000 (-18.18%) | 900,000 | 4 |
| 9 | Village of the Dead | 1,200,000 (-47.83%) | 800,000 | 2 |
| 10 | Hidden Enemy | 1,300,000 (-38.10%) | 700,000 | 2 |
That’s it for the top 10s this week—we’ll see you again next Tuesday!
